So, as previously mentioned, the hypothesis of this project is that solubility of salt diapirs will lend them into eroding into different patterns than other sedimentary strata. An outcome of this are rillenkaren features; grooved furrows that arise on the surfaces of inclined diapirs [1]. Because of the erosion patterns of diapirs, we expect to correlate diapirs with rougher radar signatures, and are testing this hypothesis with our new RADARSAT-2 images. You can see our freshly terrain corrected and processed CPR images in this previous post.
Our goal for this part of the project is to compare and contrast the mean and distribution RADARSAT-2 CPR values in the salt exposures against the surrounding rock type. To do this, we have overlain shapefiles made by Maria. She used ASTER TIR to isolate regions with strong anhydrite signatures. She also made shapefiles outlining the salt diapirs as mapped by Harrison and Jackson (2014) [2]. I took the averages of CPR in these areas, and found something concerning:
The averages of the salt are pretty similar to the surrounding rock.
 |
| Figure 1: All rocks CPR distribution (histogram slightly stretched). Average CPR: 0.32 |
 |
| Figure 2: All salt (Mapped by Maria) CPR distribution. Average CPR: 0.40 |
 |
| Yup, looks rough, as expected. |
But, alas. When looking at some of our salt signatures in more detail, we can see that there are some that are very radar-smooth!
 |
| Wait, what are you doing here? |
Supporting this hypothesis: one particularly interesting spot has high CPR at the higher elevation, and low CPR at the lower elevation. In the ASTER TIR, the signature is stronger at the top than the bottom. One point for the remobilization hypothesis!
 |
| Part of outline salt region that is brighter (red) in CPR corresponds with a higher elevation, as well as as a stronger TIR signature than the lower, darker area. |
 |
| CPR histogram for salt signatures visually classified as "remobilized" sediment deposits. Mean: 0.26. |
 |
| CPR histogram for salt signatures classified as "diapirs" or "domes" through visual mapping and comparisons with previous field mapping [2]. Mean: 0.43 |
Huzzah! These results make much more sense! We can clearly see that the eroded anhydrite sediments are being redeposited in smooth areas, while the diapirs are eroding into rougher surfaces, as hypothesized!
One note for concern: the mean value for diapir CPR, while certainly higher than mean CPR for other rocks, is still comparable to some of the clastic rock units. These are the Awingak and the Heiberg Formations. As previously mentioned, the Awingak Formation consists of quartz-sandstones. In contrast, the Heiberg Formation comprises interbedded sandstone, siltstone, and shale (interpreted as a deltaic-sandstone facies) [2]. These areas might be (are likely) the radar-bright regions in the southern portion of our CPR mapping, and will be investigated in the near future.
Using areas mapped by Harrison and Jackson [2] provide different results as well. Taking the CPR from areas strictly mapped as Otto Fiord Formation (our evaporites) we get a mean of 0.37. But, if you map CPR of areas with Otto Fiord Formation with carbonates or breccia, you get considerably higher values of 0.53 and 0.72! Wow! I have not yet explored where on the map these exposures are located, or if they correspond with some of Maria's shapefiles, but these results are certainly worth investigating further.
Note, that average values reported for rock formations are taken as an average of the averages of each of the mapped areas. In contrast, the averages and distributions for Maria's shape files are reported as average/pixel. I also took the averages/average area for Maria's areas to compare, and there is a <0.0225 discrepancy for each subset of salt regions. While plausibly minor, there some room for discrepancy in the mapped rock units.
Two variables which may be influencing CPR returns are RADARSAT-2 beam modes, and localized slope (affecting the incidence angle of the radar beam).
The beam modes used for our images include FQ19W, FQ20W, FQ21, and FQ21W. "FQ" means that the images were taken with Wide Fine Quad Polarization, providing us with larger target areas and finer resolutions than standard images, as well as full polarization images (HH+VV+HV+VH). These correspond with near incident angle ranges from 37.7°-40.2°, and far incidence angles from 40.4°-42.1° [3]. Slopes will also affect local incidence angle, and thus the amount of radar return. Slopes facing the incident beam will reflect stronger signals than those reflecting away.
Well, that was more than your daily dose of diapirs and domes and salts (oh my)!
Happy mapping!
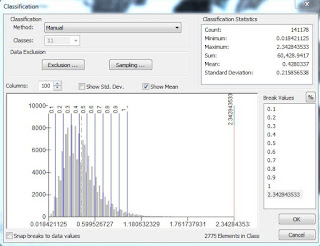
P.S. I presently don't know to make better histograms from ArcMap, than those I've extracted from the symbology tab. Looking for any advice on how to improve my data representation, or how to export the data for use in other programs!
[1] Stenson, R.E., and Ford, D.C. 1993. Rillenkarren on gypsum in Nova Scotia. Geographie physique et
Quaternaire, 47: 239–243.
[2] Harrison and Jackson (2014) Exposed evaporite diapirs and minibasins above a canopy in central Sverdrup
Basin, Axel Heiberg Island, Arctic Canada. Basin Research 26, 567–596, doi: 10.1111/bre.12037
[3] MacDonald, Dettwiler and Associates Ltd. 2016. RADARSAT-2 product description. MacDonald, Dettwiler and Associates Ltd. RN-SP-52-1238 1(13), Richmond, B.C. Available from http://mdacorporation.com/docs/default-source/technical-documents/geospatial-services/52- 1238_rs2_product_description.pdf?sfvrsn=10 [accessed 28 October 2016].
[3] MacDonald, Dettwiler and Associates Ltd. 2016. RADARSAT-2 product description. MacDonald, Dettwiler and Associates Ltd. RN-SP-52-1238 1(13), Richmond, B.C. Available from http://mdacorporation.com/docs/default-source/technical-documents/geospatial-services/52- 1238_rs2_product_description.pdf?sfvrsn=10 [accessed 28 October 2016].
RADARSAT-2 Data and Products (c) MacDonald, Dettwiler and Associates, Ltd. (2016) - All Rights Reserved. RADARSAT is an official trademark of the Canadian Space Agency.