Monday, January 16, 2017

New Year and Fresh Starts

Hello everyone, and Happy New Year!

I'm back at Western after a wonderful winter break with my family in Vancouver.

Some general house-keeping:

In my first week back, I've been doing some general "house keeping" with my data.  I'm getting myself organized by deleting duplicate and unwanted files from awry processing.  I think it is a common problem: if you are trying a new tool in ArcGIS, are processing a new dataset, or input the wrong variable, you get erroneous files. I know that at least for me, these mistakes can sometimes get ignored as I'm too focused on "getting it right", and these can clutter up folders with the good data. I'm getting rid of these, and also making sure everything is labeled so data is easy to find and folders are easy to navigate.

On a tangent, it is also important to make sure you have good "metadata" or data about your data. For the RADARSAT-2 images I'm working with, I make sure to include notes about the number of looks in the azimuth and range directions when doing multilook processing. This lets me know how smoothed over my images are.  The numbers of looks are different depending on the end products. For example, CPR images tend to be very noisy, so I use more looks for CPR images than when I'm performing a Pauli Decomposition. It is important that I, and anyone else who may need to look at my files, know what I did, so I'm working on making a key that explains my data.

At AGU in December, one of the workshops I attended during the Student & Early Career Scientists Conference focused entirely on  "Improving Your Science Through Better Data Management", and I learned a few tricks that I'm starting to implement. Not that you need any convincing, but here is a cute cartoon they shared that further emphasizes why data management is important, especially when you might need to share data with other scientists.


Moving forward - Acquiring PALSAR data:

My data management is being done now to prepare for the incoming of new data!  Yay, new data!

I have recently put in a request to the Alaska Satellite Facility to get data from the Japan Aeronautics Exploration Agency's Advanced Land Observing Salilite (ALOS).  ALOS had an L-band radar, called PALSAR. Like RADARSAT-2, PALSAR also has fully polarimetric capabilities. The two radars have different wavelengths. RADARSAT-2 is a C-band radar, with a wavelength of 5.5 cm, while PALSAR's L-band has a wavelength of 23.6 cm. We can use both datasets together to explore the surface roughness at different scales.  For example, surfaces that look rough in C-band radar may appear rough in L-band radar, and vice versa.  Comparing apparent roughness at different scales from the two different radar instruments can help us constrain the scale of surface roughness of the salt diapirs on Axel Heigberg Island.

I'm a little disappointed that there isn't very much PALSAR quad-pol coverage of our study site in Expedition Fiord, but it does look like at least a couple prominent diapirs are covered, so we will focus on those.

Batch Processing:

It was brought to my attention that I can really speed up radar data processing by implementing "batch processing" i.e., doing multiple images at once.  This will be really useful when the PALSAR data comes in, so I'm testing it out with my RADARSAT-2 images in SNAP.  So far I have not succeeded, but I've only just started playing around and troubleshooting.

Maybe some basic programming will help with that, speaking of which...

Developing computer skills:

One of my colleagues here at Western, Denis Vida, has put together an informal, non-credit Python Immersion course/workshop. My programming abilities are wanting, and if you remember from before I can barely navigate a command line, (barely, but I can!😊) My previous Python experience is limited to completing the Codecademy online course, most of which needs much refreshing. Fortunately, Denis has referred us to a free, online tutorial on computer programming through Udacity that I am going through to get up to speed. Looking through the e-mailing list for the workshop, it looks like I will be in good company with most of my labmates also attending.

Sunday, January 15, 2017

2016 American Geophyical Union Fall Meeting

Hi hi~

I am very grateful to have had the opportunity to attend the American Geophysical Union Fall Meeting in December.  It was a great experience to meet new people, reconnect with colleagues,attend career development workshops, learn about the cutting edge of geology, geophysics, and planetary science, and have the opportunity to present my own research.

This post may seem lengthy, but I'm also partially writing it as a means to refresh myself with all the events from the conference. The week went past like a whirlwind, and there were a lot of interesting topics I'd like to follow up on.  I hope you're interested, too!

View of the Moscone South building (Poster Hall) from Moscone West (Oral Sessions)


Highlights

Student & Early Career Scientists Conference

I arrived a day early to attend the Student & Early Career Scientist Conference - a daylong series of career development workshops. Only a few weeks prior I had made an offhand comment to my labmate Gavin that I wished there were courses we could take on data management, and making scientific figures. To my delight, this event offered both! Hour long talks included, "Making Figures Talk: Data Visualization for Scientists" and "Improving Your Science Through Better Data Management: Tips and Techniques".  The notes from the data visualization workshop are available online if you're interested. A couple tips I plan on trying are using white instead of black lines on bar graphs to make them sharper, and using partial transparency on scatter plots to see overlapping points. We were also warned that the "rainbow" colour scale, frequently used for raster datasets, has a couple sharp steps that can make it seem like there is a bigger change than their really is. This is something to keep in mind, because we use the rainbow scale for our CPR images.

Exhibitor Hall


Exhibitor's Hall, immediately upon opening

Okay, aside from the ridiculous amounts of swag collected (many new posters are now decorating my apartment) there were a lot of interesting things going on in the Exhibit Hall.  The Google booth hosted many short talks on using remote sensing to monitor and study global environmental issues. Western alumni, Tanya Harrison, had a featured talk on Martian gullies at Arizona State University's booth.

Western alumni, Tanya Harrison, gives a talk on Martian Gullies
I also learned that many Asian institutions are running hiring initiatives to attract foreign early career scientists for new faculty positions.  If you are a post-doc interested in working in Asia, this is your time to shine.

Poster Hall

Tim Haltigin from the Canadian Space Agency presented a well-designed, highly popular poster on the 2016 CanMars mission.  CanMars was a highly successful, collaborative analogue Mars sample return mission that ran mission control operations here at Western last November. I had the pleasure of taking part in the mission as a member of the GIS & Mapping team, and am thoroughly grateful for the opportunity.

Maria's poster and my talk complimented each other really well.  She presented the results from her internship with Dr. Neish over the summer, using thermal infrared spectroscopy to identify and map anhydrite salt exposures on Axel Heiberg Island, NU.  I presented results in which I extracted the zonal statistics for CPR values in the areas she mapped as salt. Unfortunately, her poster presentation was during the time slot of my oral session, so I wasn't able to visit her during poster-time, but I did have the privilege to talk with her about it before and after.

Really cool radar stuff: I roamed through a few really interesting poster sessions that employed polarimetric radar for planetary atmospheres and meteorological studies. In the back of my mind, I was vaguely aware that this was a thing people do, but hadn't previously thought about how it works. Many studies explored the  using different bands of polarimetric radar to estimate precipitation and storm intensity, which is important in risk assessment in coastal nations like Korea (Gu et al. 2016; Lim et al. 2016). One of the studies measured the distribution of raindrop size, which can then be correlated with the storm severity for hazard prevention. Another study uses C and S band radar for distinguishing size of hail particles, which is important in central Europe where hail can be the size of tennis balls (Schmidt et al. 2016).

Not radar, but another session focused on using passive polarimetry as a tool to study planetary bodies, including spaceweathering on the moon (Kim et al. 2016), the surface texture of Europa (Nelson et al. 2016), and even the composition of organics in meteorites (Kobayashi et al. 2016)


Oral Sessions

One of my favourite oral sessions entailed a group of prominent Mars researchers discussing Mars's past as either "cold and dry" or "warm and wet".  I didn't realize that the "cold dry Mars" theory had much footing, but field analogues from Dry Valleys, Antarctica shows that even in very cold dry places there is significant seasonal melting that can form erosional features (Head 2016). Robin Woodsward similarly suggests that early Mars may have been more Titan-like, with a cold, dry climate and episodic melting that can explain fluvial features (Wordswarth 2016).  I had the pleasure of meeting some of the presenters after this session and discussed current advancements in planetary science.

My talk was also quite successful!  Despite being in the last session of the final day, there was a reasonable turn out. I met Dr. Gerald Patterson and Dr. Lynn Carter before the session, and they were both positive and asked insightful questions after my talk. Another gentleman approached me afterwards, asking if we have used any Sentinel-1 data for our student.  We have not, but I mentioned that we are about to request PALSAR data.  The other talks in this session were really interesting, too.  One gentleman from Arceibo gave an overview of how Arecibo is used for planetary exploration (Taylor 2016).  Dr. Carter gave a talk about how they have constructed giant vats of ice and sediments at the Goddard Flight Center to try and simulate data from SHARAD, the shallow ground penetrating radar orbiting Mars (Carter et al. 2016).

Social Events

The NASA hosted Planetary Science division Townhall.  I met Jim Green, and asked about the current relationship and collaborations between NASA and the CSA. Bethany Ehlmann from Caltech was also a speaker at this session. I worked with her during our Arctic field season last summer, and it was great to see her again.

Bethany's career advice for students and early career scientists,
1. Don't give up on your rejected proposals
2. Papers. Papers, papers, papers. Grad students should focus on writing good papers.

Panelists at the NASA Planetary Science Division Townhall meeting
I also attended the Planetary Science meeting/reception, and the earth and planetary surface processes reception. Both events were great for networking. I reconnected with colleagues from LPI, and met sedimentologists from the University of Bristol who introduced me to a few prominent Martian surface scientists.

San Francisco

Of course, I also took time to explore San Francisco!  I had never been to the city before, and was able to have the chance to visit Chinatown, Fisherman's Wharf, and Pier 39.One of my favourite parts of traveling is trying local food, so I'm happy that I was able to eat some dim sum, sourdough bread, and Ghirardelli chocolate.


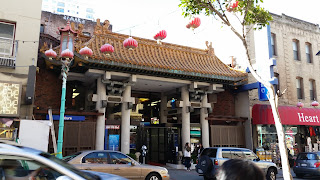
Fancy bank in Chinatown
View of Alcatraz prison from Fisherman's Wharf


Golden Gate Bridge as seen from Fisherman's Wharf

SOURDOUGH BREAD FACTORY! YUM!


Overall, I highly recommend the American Geophysical Union Fall Meetings. I had a great time, learned lots, and met a lot of incredible people.  Cheers!