In the summer of 2015, I had the opportunity to take part in the Misasa International Summer Internship Program in Misasa, Japan. The program has two branches: Geochemistry and Geophysics. I took part in the Geochemistry program, hosted by the Pheasant Memorial Laboratory. Six of us worked as a team to analyse the compositions of three meteorite samples, and interpret any relationships between mineral phases and degree of thermo-metamorphism. All three were enstatite chondrites, the rarest type of meteorite, constituting only 2% of discovered falls. Our samples are as follows:
 |
| Things are getting pretty hot right over here |
"E" designates that they are enstatite chondrites. H/L refers to them containing relatively high iron or low iron. The number refers to the degree of thermo-metamorphism, with 7 being the highest (totally melted). Eagle shows the highest degree of thermo-metamorphism of our samples, and Sahara has the least. The differences between them are striking. Sahara is completely heterogeneous with abundant condrules, whereas Eagle's minerals are equigranular. Sahara is so primative, that not only is there an abundance of perserved glass matrix, but we even found a Calcium-Aluminium Inclusion! (CAI) For those unaware, CAIs are the oldest known particles in the solar system, so this is a pretty incredible find. In the middle, NWA-1222 is also heterogenous, but does not have any condrules. What is most interesting about NWA-1222 is that it seems to show intermediate exsolution phases of Cr and Fe-S minerals as the sample was heated up, but not to the extent or duration of Eagle (whose phases have completely exsolved).
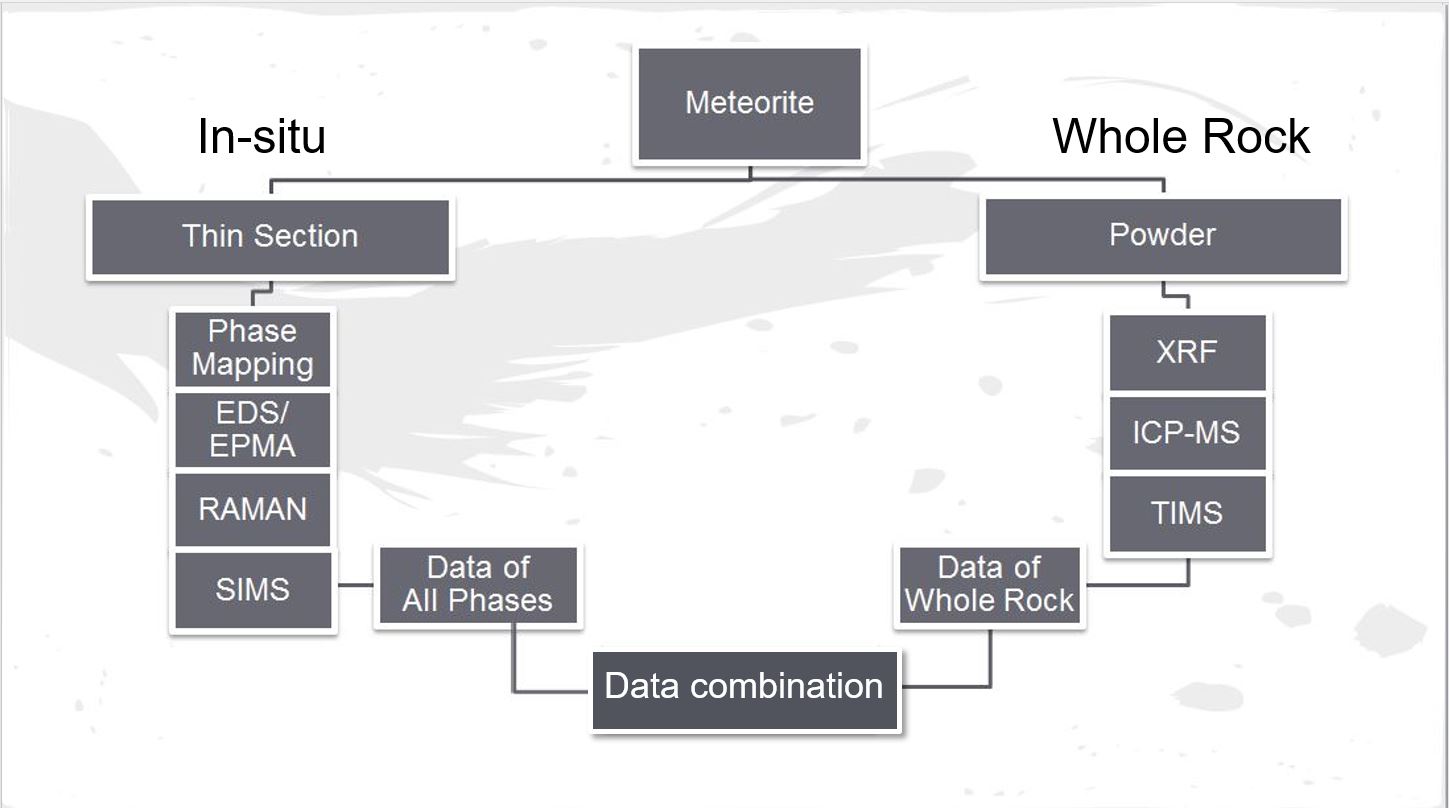
Our objectives are to determine:
- The mineralogical composition of the samples using in situ analysis
- The chemical composition of the samples using whole rock geochemistry
- How the distribution of elements changes between mineral phases as metamorphism increases
- The mineralogical composition of the samples using in situ analysis
- The chemical composition of the samples using whole rock geochemistry
- How the distribution of elements changes between mineral phases as metamorphism increases
- Age date the samples
 |
| The Pheasant Memorial Laboratory has every beautiful piece of equipment you could ever want. |
Using both the in-situ and whole rock geochemistry techniques together allows us to build a broader picture of how these samples evolved through time and space (pun intended). In summary, we looked at mineral shapes and probed their composition with the scanning electron microscope-electron microprobe fancy hybrid machine, as well as crush up and dissolve bits of the meteorites in acid to find out what the powder was made of. My favourite part was using the ICP-MS, where I got to blast little holes in our meteorite samples for element analysis.
 |
| I'm pipetting something dangerous! |
The resulting products were pie charts to show the distribution of elements in different mineral phases (not shown).
 |
| Introductory analytical geochemistry in a nutshell. I have not shared any elemental analysis pie charts in this post, but you know they exist and what they show. |
What we found:
EH3 (Sahara)
- Intergrowths of kamacite (Fe0.9Ni0.1) and troilite (FeS), forming a granophyric-like texture. These two minerals are fully separate phases in the EL5 and EL6 meteorite.
- CAI contains many complex mineral phases that are not found elsewhere in the sample
- An unknown interstitial "glass" phase contains ample amounts of alkali elements.
- RAMAN identified christobalite (>1470oC silica polymorph)
EL5 (NWA-1222) - Elise's favourite
- Mineral shapes are irregular
- Fantastic exsolution texture between a chromium-bearing phase (proto-daubreelite (FeCr2S4) and troilite (FeS). There is also exsolution of a Mn-rich mineral out of troilite.
-RAMAN identified tridymite (870oC - 1470oC silica polymorph)
- Fantastic exsolution texture between a chromium-bearing phase (proto-daubreelite (FeCr2S4) and troilite (FeS). There is also exsolution of a Mn-rich mineral out of troilite.
-RAMAN identified tridymite (870oC - 1470oC silica polymorph)
 |
| I feel fuzzy, proud, and excited every time I look at this figure. We were getting anomalously high chromium readings for the troilite minerals (2%). Upon closer inspection, there are small minerals of daubreelite with high Cr (10%) exsolving out of the troilite. Also the same is happening with manganese, but that is covered by the watermark and isn't discussed as much in this post. |
EL6 (Eagle)
- Exsolution of daubreelite (FeCr2S4) and troilite (FeS) is near completion!
- Crystals are (sub) euhedral
- "Mystery" SiO2 phase -> used RAMAN spectroscopy to detect sinoite (Si2N2O), which previous literature explicitly states is not in Eagle. It's always a good day when you prove someone wrong.

Big picture:
From the exsolution of Cr-phases between the EL5 and EL6, we can constrain the temperature of metamorphism. The transition of Cr-Troilite to Troilite + Daubreelite occurs below 800oC. SO COOL! (because it's below 800oC? Get it?) I have a ternary diagram that illustrates this, but this post already has quite a few technical figures. I was the ternary diagram-shishou (master) in my Misasa MISIP cohort.
We can also constrain the temperature of metamorphism further to being between ~600-800oC by the relative abundances of magnesium sulphides and manganese sulphides. I made a ternary diagram for that, too. It is nice when your minerals agree with one another.
There is a continuous depletion of sodium from the least to most metamorphosed. This is evinced by feldspar composition. K and Na depletion in feldspars may indicate loss of low melting point material with increasing temperature. I will bless you with at least one of my ternary diagrams.

Age dating
Couldn't age date Sahara (EH3) because we only had a thin section and no bulk sample.
Both Eagle and NWA-1222 showed Sm/Nd isotopes dating close to the age of formation of the solar system, and Rb/Sr ages close to the late heavy bombardment. It is possible that the Sm/Nd age pertains to the age of formation, while the Rb/Sr ratio dates the age of metamorphism.
In conclusion:
The exsolution of Fe/Mn/Cr phases consistently occur ~600-700oC. The exsolution lamallae are indicative of slow cooling. This texture constrains peak metamorphism temperature, which likely occurred during the late heavy bombardment period.
The exsolution of Fe/Mn/Cr phases consistently occur ~600-700oC. The exsolution lamallae are indicative of slow cooling. This texture constrains peak metamorphism temperature, which likely occurred during the late heavy bombardment period.
We used RAMAN to identify different silica polymorphs. These minerals likely formed prior to chondrite accretion, but this constrains our temperatures of formation, which was likely during the formation of the solar system. Further, we found sinoite in Eagle, which wasn't supposed to be there.
This post ended up way longer than I expected. I admit that it is still a quick synopsis of this project, with a plethora of important details and measurements missing. If you're interested, feel free to contact me and I'm happy to discuss our enstatite chondrite study with you!